Data Quality Score
The Data Quality Score is the centerpiece of the profiling Overview dashboard. Displayed as a donut chart, it provides a single percentage that summarizes the overall quality of your datasource. This score helps you make a quick decision about whether your data is ready for matching or needs cleansing first.
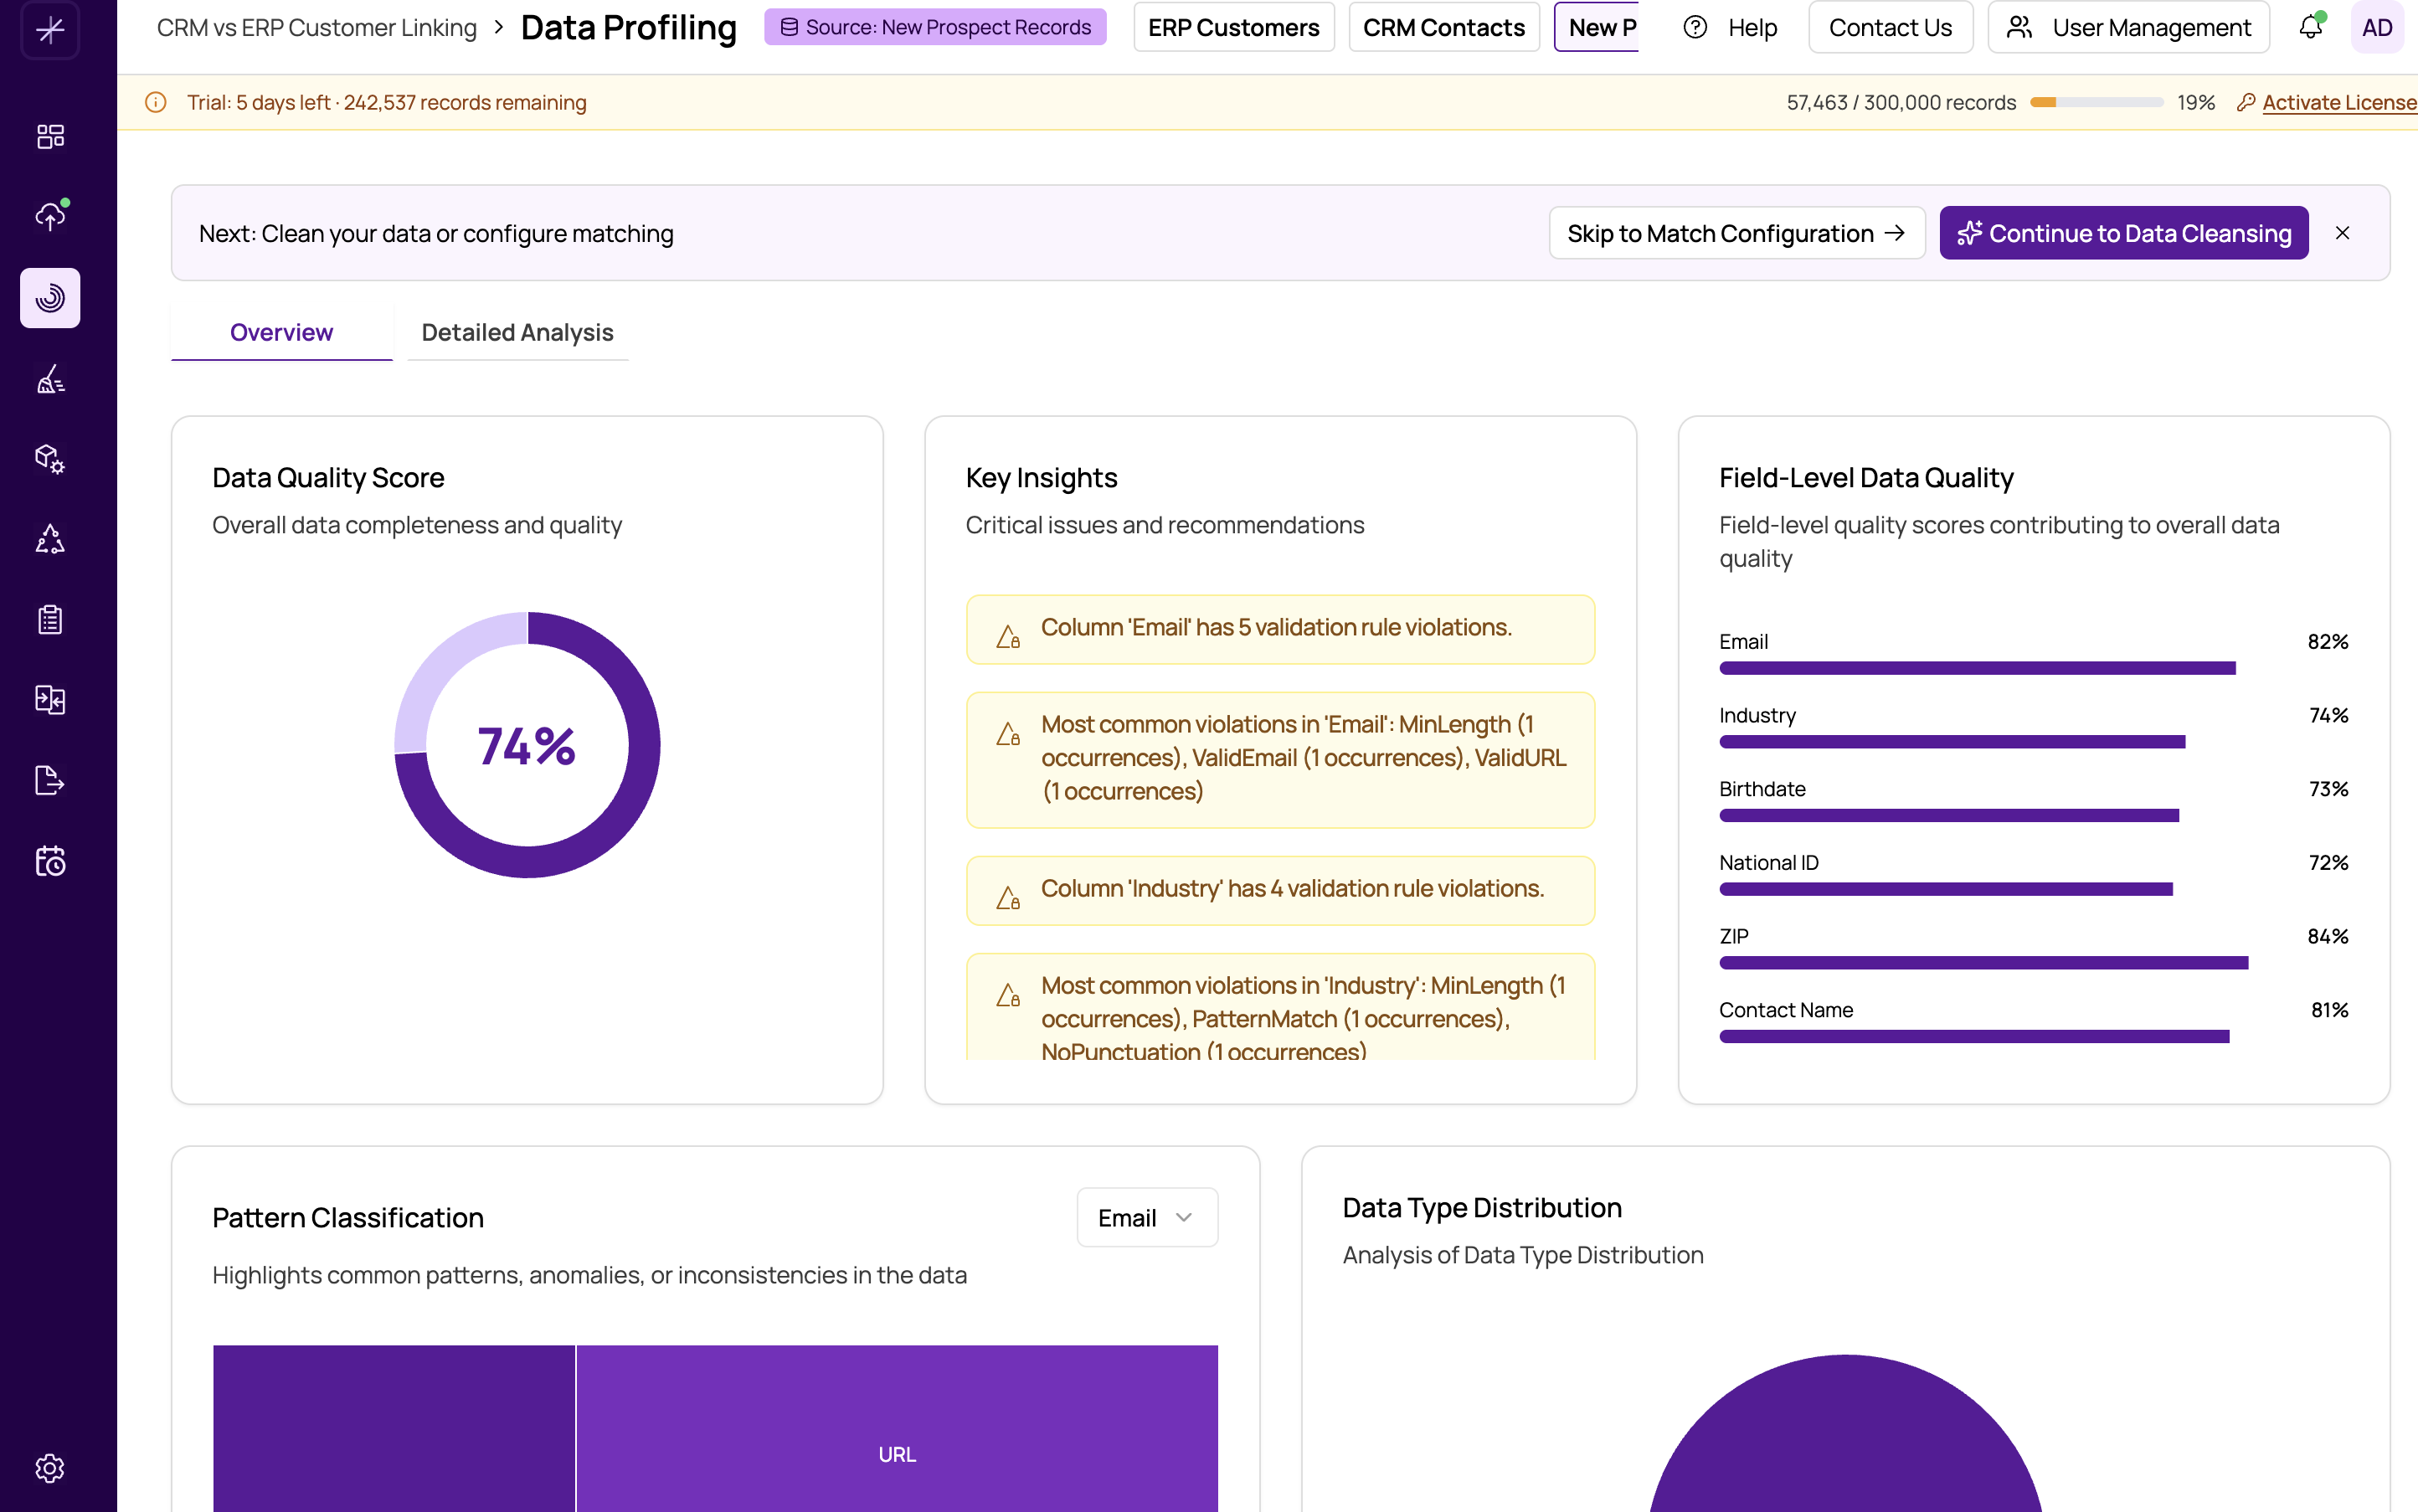
How the Score Is Calculated
The Data Quality Score is a weighted composite derived from three core dimensions measured across all fields in your datasource:
- Completeness -- The ratio of filled (non-null) values to total records. A field where 950 out of 1,000 records have values scores 95% on completeness. Fields with many missing values drag the overall score down.
- Validity -- The percentage of values that match expected patterns for their detected data type. For example, if a field is detected as an email type, values like "user@example.com" are valid while "not-an-email" is invalid.
- Uniqueness -- How many distinct values exist relative to the total record count. This contributes to the overall score because fields with reasonable uniqueness levels tend to be more useful and better maintained.
These dimensions are aggregated across all columns and weighted to produce the final percentage shown in the donut chart.
Interpreting the Score
Use the following guidelines to interpret your Data Quality Score:
- 80% and above -- Your data is in good condition. You can proceed to matching with confidence, though you may still want to review individual fields.
- 60% to 79% -- There are noticeable quality issues. Review the field-level breakdown and consider applying data cleansing to the most problematic fields before matching.
- Below 60% -- Significant quality problems exist. Data cleansing is strongly recommended before attempting to run matches. Matching on low-quality data will produce unreliable results with many false positives or missed matches.
What Affects the Score
Common factors that lower your Data Quality Score include:
- High null rates in key fields (names, addresses, identifiers)
- Inconsistent formatting (mixed date formats, phone number styles)
- Data entry errors (typos, transposed characters)
- Non-printable or unexpected characters in text fields
- Values that do not match the expected type (letters in numeric fields)
Tip
Run a profile before and after data cleansing to see how much your quality score improves. Even simple transformations like trimming whitespace and standardizing case can produce a noticeable increase.
Important
A high quality score does not guarantee perfect match results. It means the data is structurally sound. You still need to configure appropriate matching definitions and review results carefully. Conversely, a lower score does not mean matching will fail -- it means you should expect more noise in results and consider cleansing first.
Related Metrics
For a deeper understanding of what drives your quality score, explore the individual components: completeness-filled-vs-null, validity-and-pattern-analysis, and uniqueness-and-duplicate-indicators.