Previewing Cleansed Data
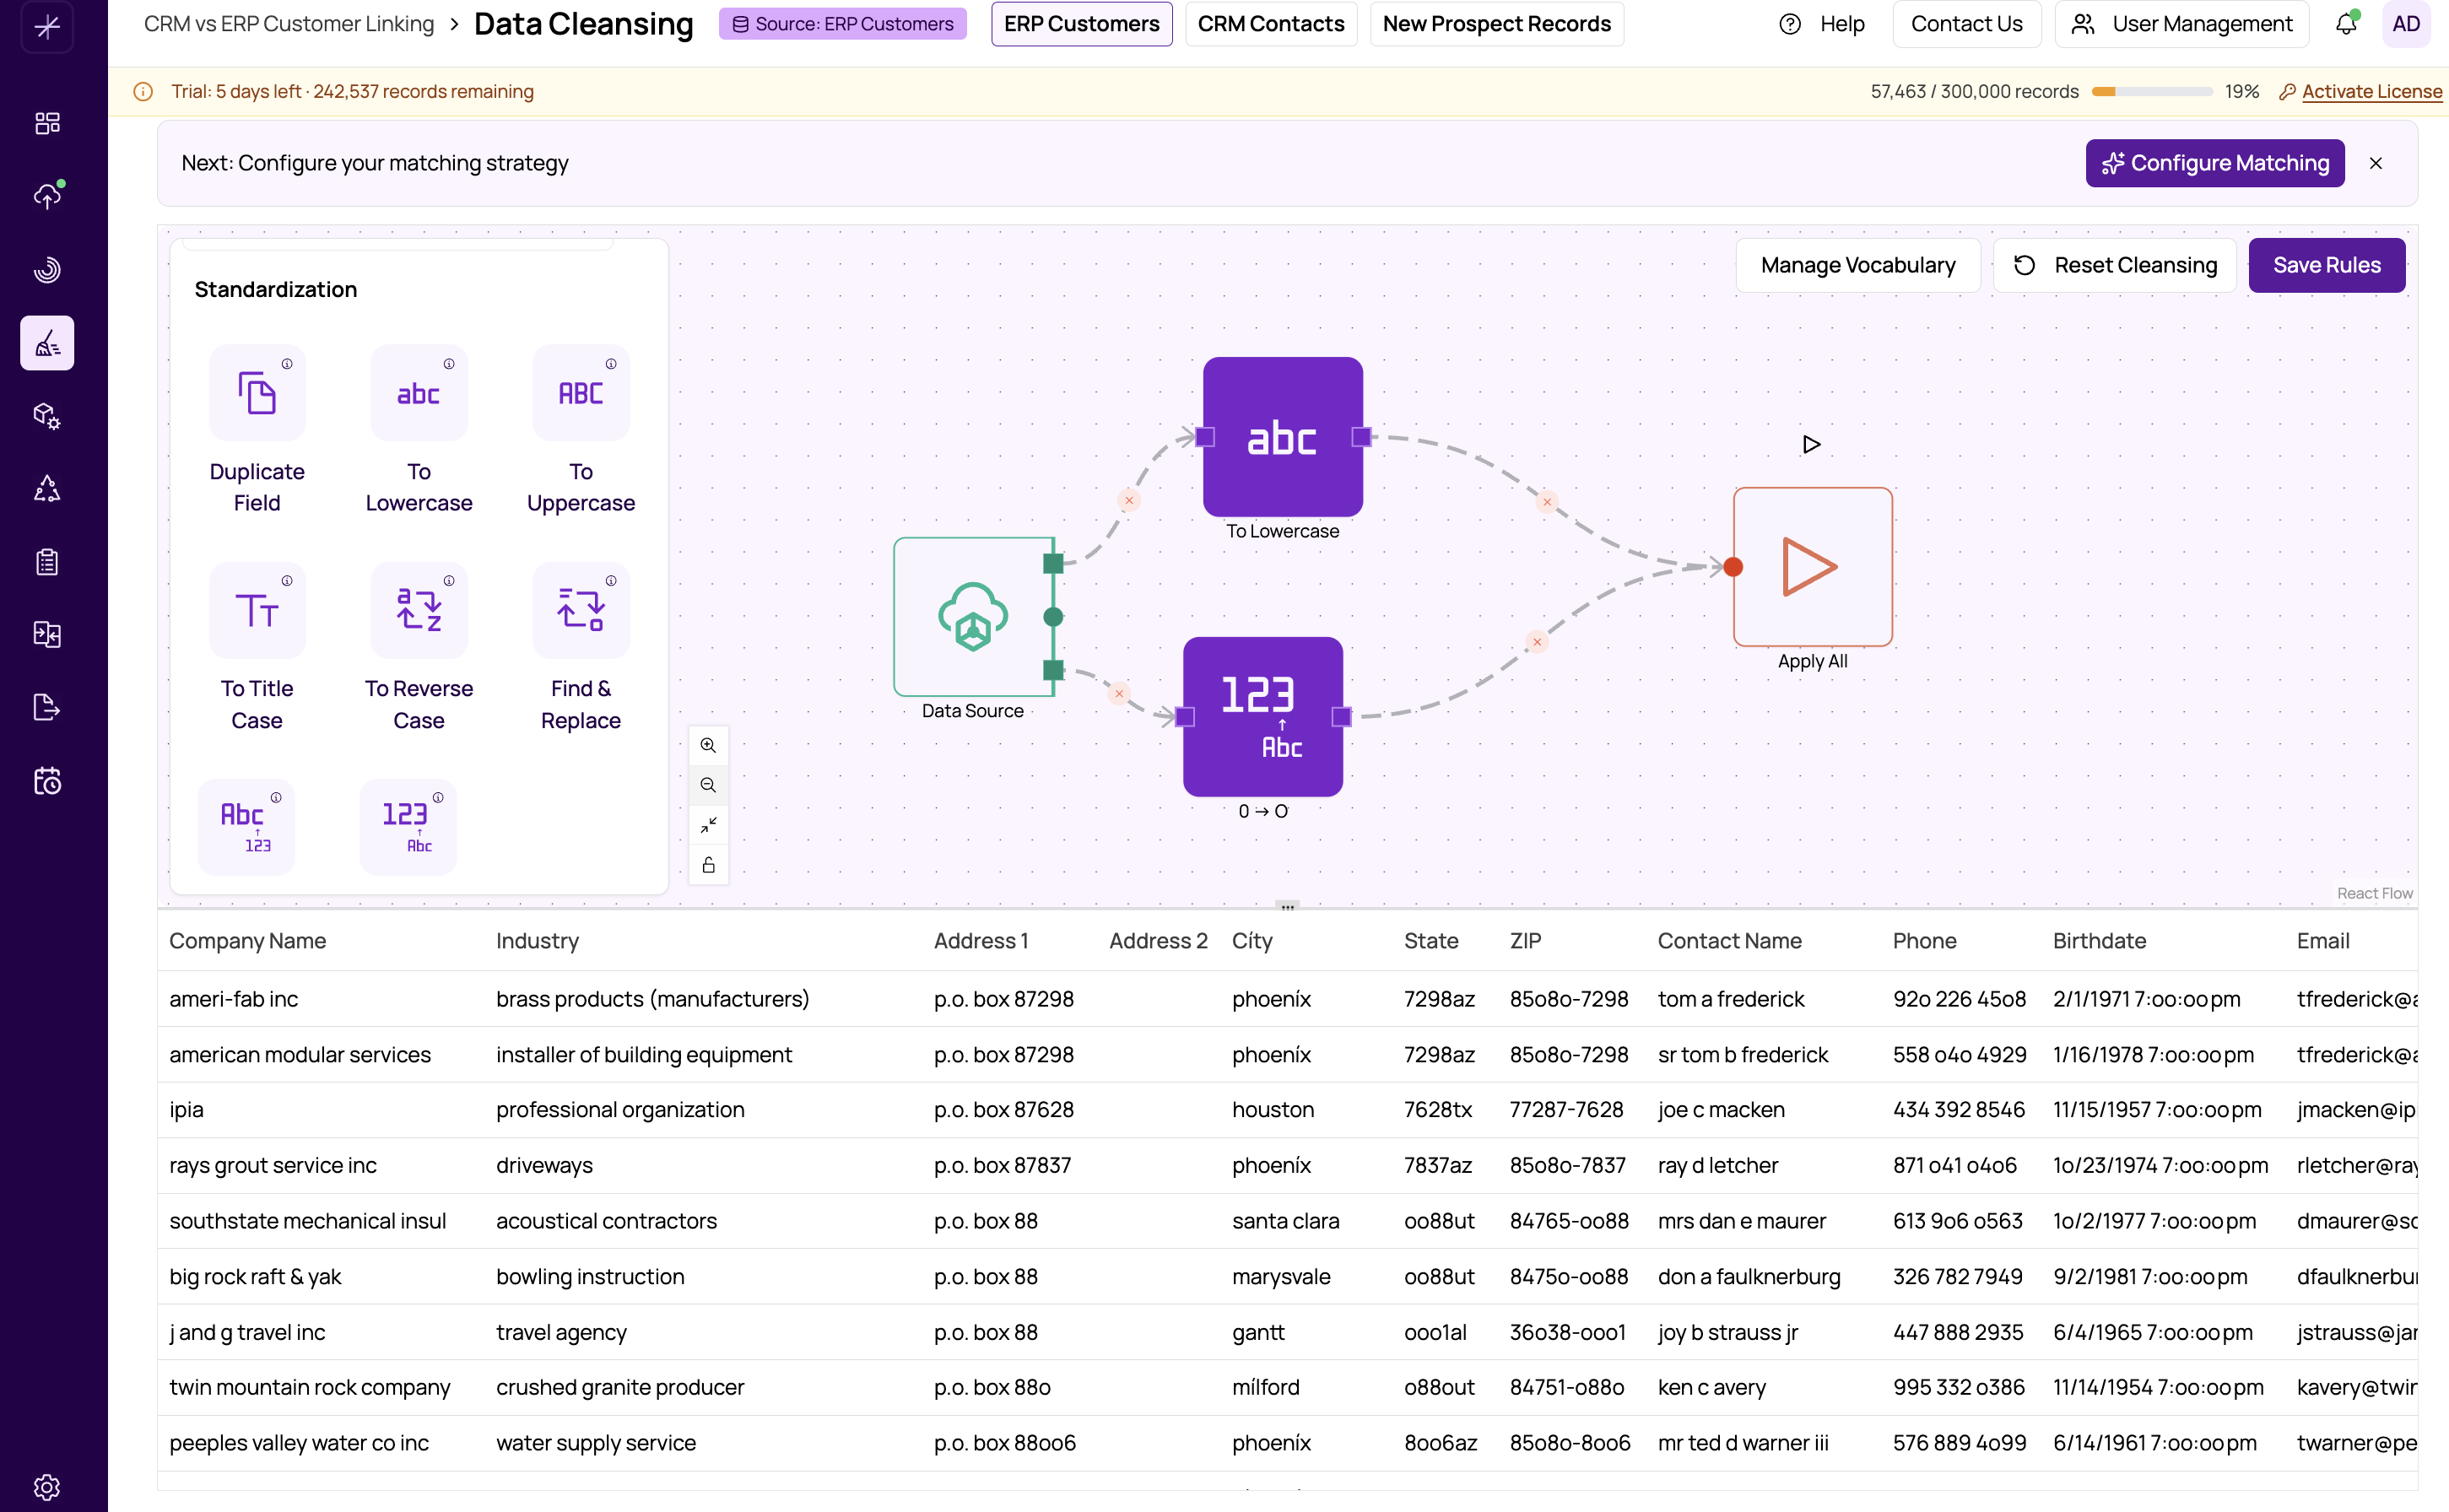
The preview panel at the bottom of the flow builder gives you immediate visibility into the effect of your transformations. After running any node, you can see the resulting data in a scrollable table, letting you verify that your cleansing operations are producing the expected results before committing to the full workflow.
How the Preview Works
When you run a node in your workflow, MatchLogic executes the transformation and loads a sample of the resulting data into the preview panel. The table displays:
- Column headers — The field names from the processed schema at that point in the workflow. If a node creates new columns (like the Address Parser), those columns appear here.
- Data rows — A sample of records showing the actual values after the transformation has been applied.
The preview reflects the state of the data at the node you ran. If you run a node early in the workflow, you see the data after that node's transformation but before any subsequent nodes have been applied.
Comparing Before and After
To compare original and cleansed values:
- Run the Start node — This shows the raw, untransformed data from your datasource.
- Run a transformation node — This shows the data after that transformation has been applied.
By alternating between running the Start node and other nodes, you can see exactly what changed. This is particularly useful for verifying that Replace or Remove operations are targeting the correct values.
Scrolling and Navigation
The preview table supports:
- Horizontal scrolling — If your dataset has many columns, scroll right to see additional fields.
- Vertical scrolling — Scroll down to see more rows of data.
- Resizable panel — Drag the top edge of the preview panel to make it taller or shorter, giving you more room to examine the data or more room for the canvas.
When the Preview Updates
The preview panel updates each time you explicitly run a node. It does not update automatically when you change node properties or add new connections. This is by design — it ensures you see stable results and only refreshes when you choose to execute.
To update the preview:
- Click the node you want to inspect.
- Click the Run button on the node or in the properties panel.
- Wait for the execution to complete — the preview panel will update with the new results.
Using Preview Effectively
- Spot-check frequently. Run nodes after configuring them to catch issues early, rather than building a long chain and only previewing at the end.
- Focus on affected columns. Scroll to the column that your transformation targets and verify the values look correct.
- Watch for empty values. If a transformation produces unexpected empty cells, the pattern or configuration may need adjustment.
- Check new columns. When using nodes that create new columns (Copy Field, Address Parser), verify the new columns appear with the expected names and values.
Tip
The preview shows a sample of your data. For very large datasets, spot-check the preview and then run the full workflow to apply transformations to all records.