Profiling Takes Too Long
Data Profiling analyzes every value in every column of your datasource to compute statistics, detect data types, find patterns, and flag anomalies. This is inherently a full-scan operation, so profiling time scales directly with the number of rows and columns in your dataset.
What to Expect
- Small datasets (< 100K rows): Profiling typically completes in under a minute.
- Medium datasets (100K–1M rows): Expect 2–10 minutes depending on column count and server resources.
- Large datasets (1M+ rows): Profiling may take 15–60 minutes or longer. This is normal.
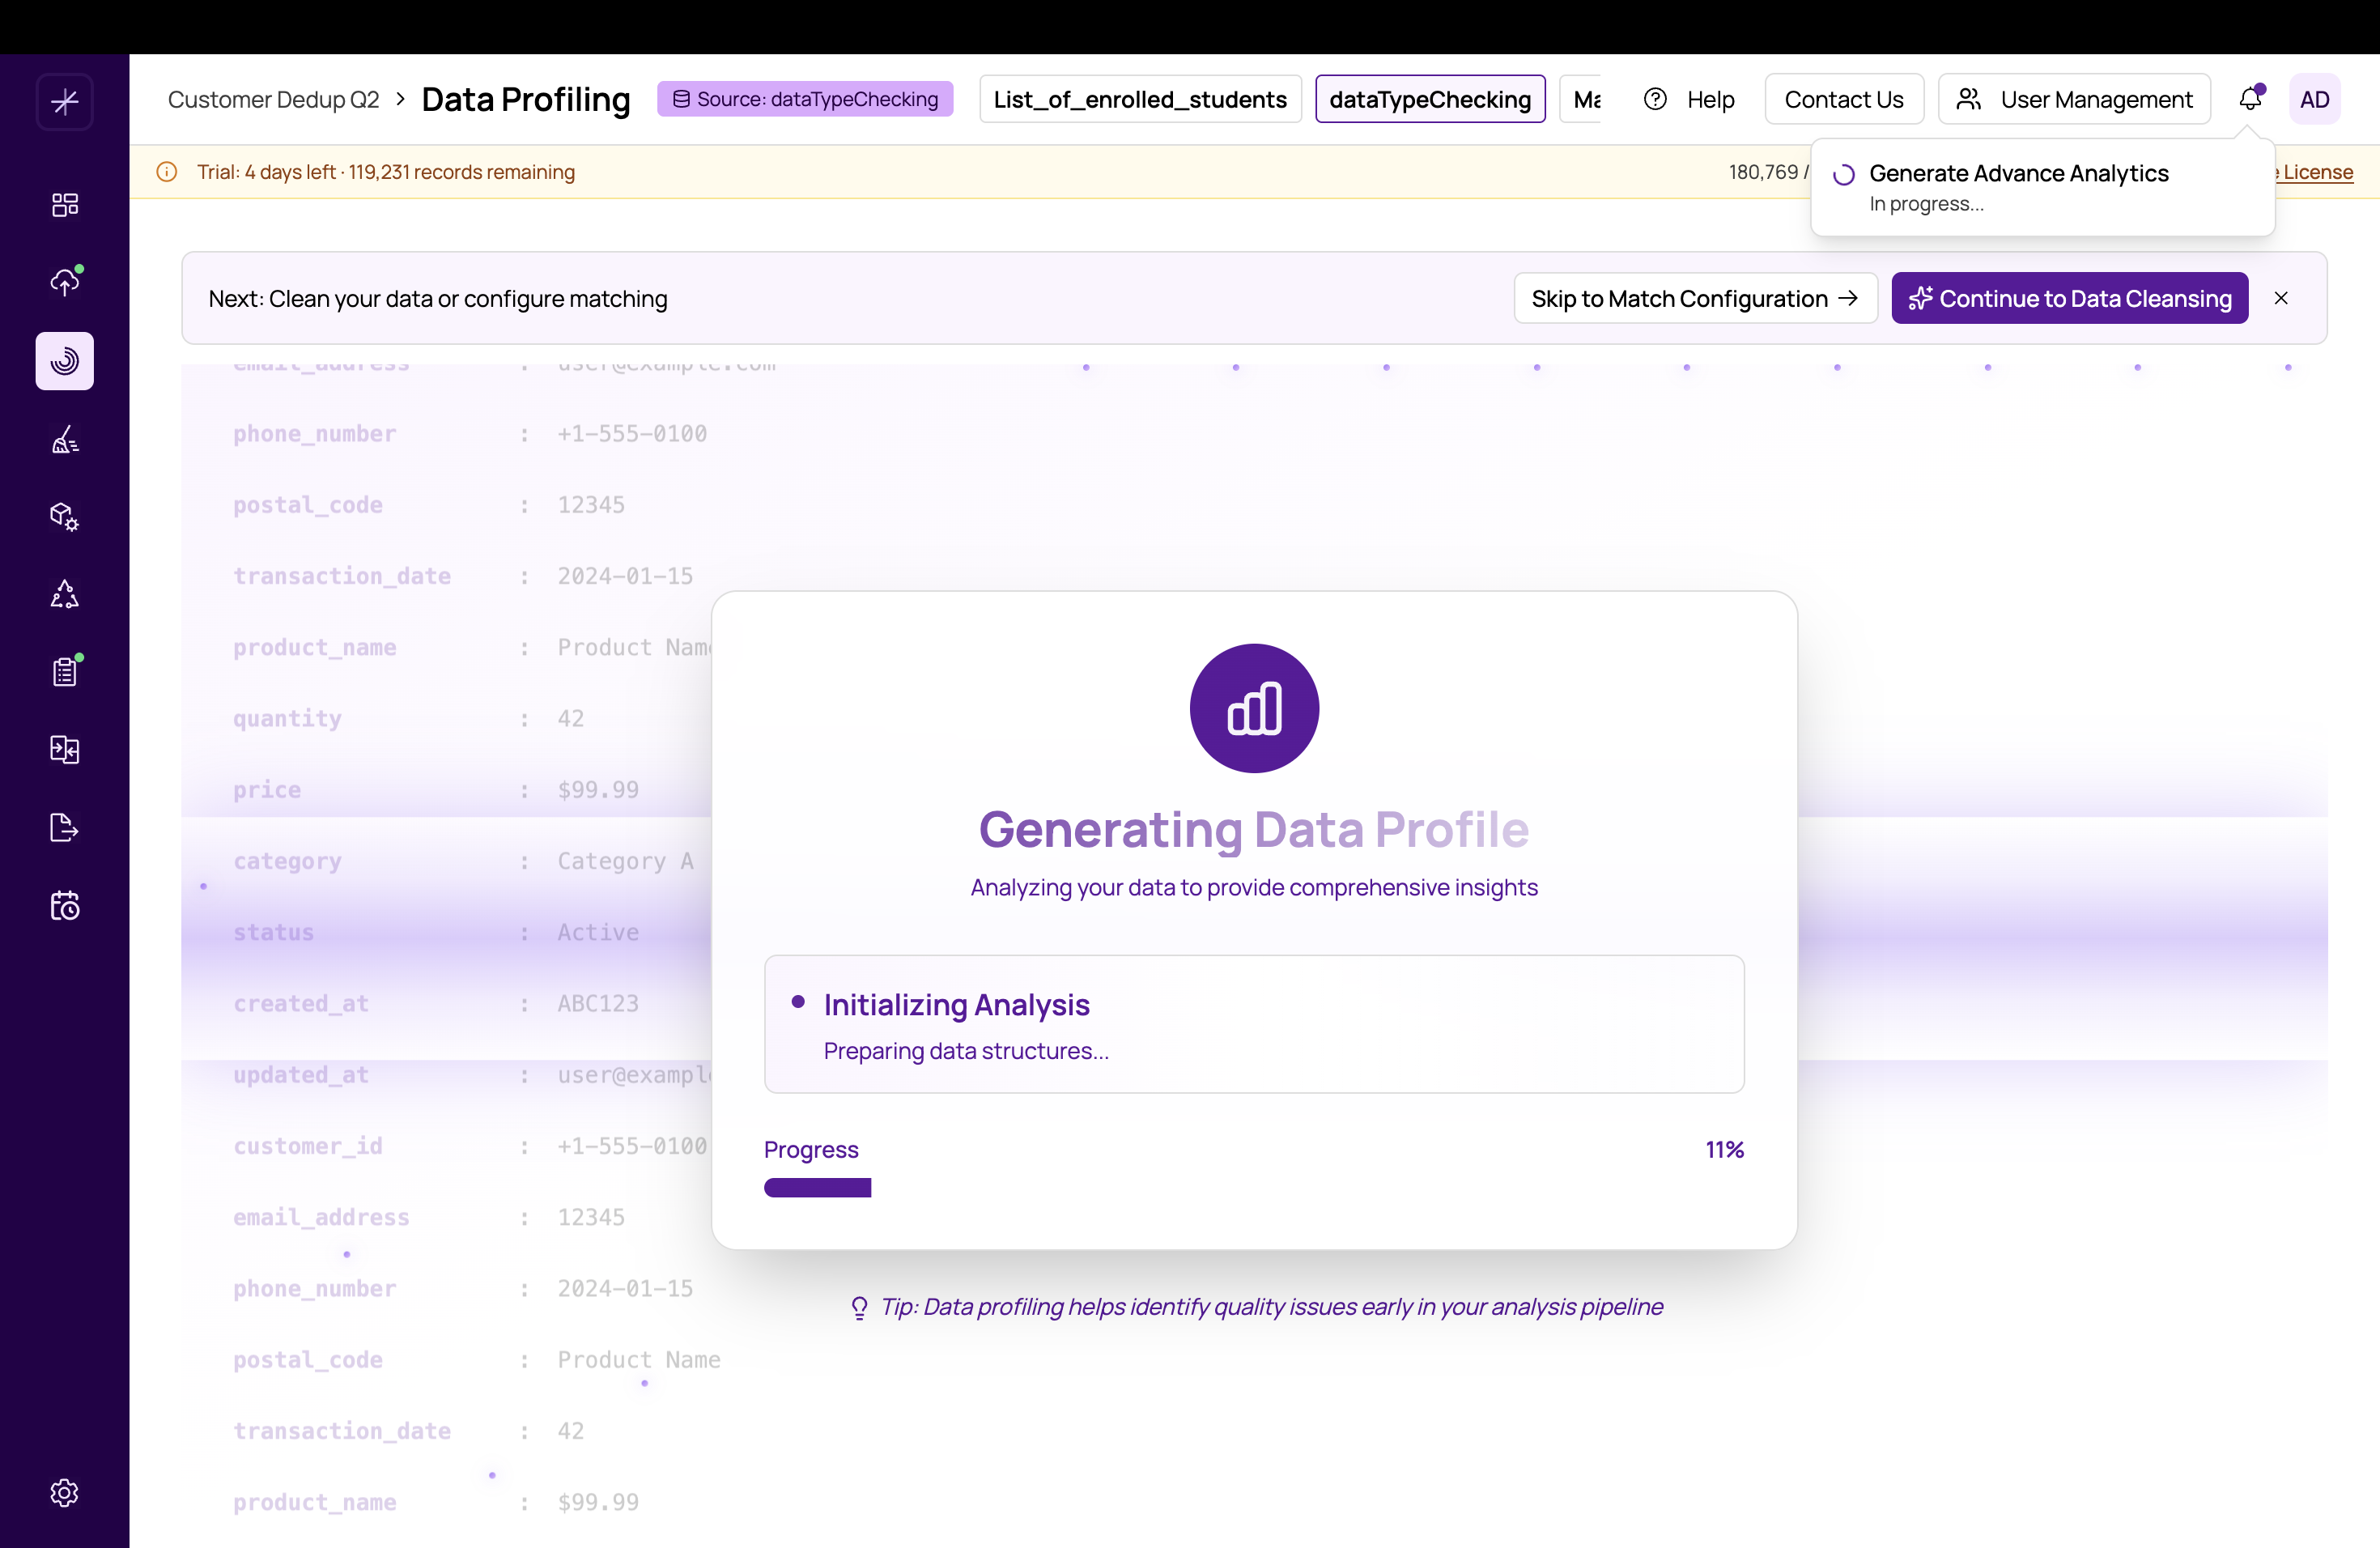
Profiling runs in the background. You can navigate away from the Data Profiling page after starting the job. A notification will appear when it completes. You do not need to keep the page open.
Strategies for Faster Profiling
1. Run Profiling Once and Reuse
Profiling results are stored and remain available until you re-run the job. If your data has not changed significantly, use the existing profiling results rather than re-running. Only re-profile if you have imported a new version of the datasource or significantly changed the data.
2. Profile a Representative Sample
If you need quick profiling insights on a very large dataset, import a representative sample (e.g., 10% of records) as a separate datasource, profile that, then import the full dataset for matching. The profiling insights from the sample will still guide your cleansing and matching decisions.
3. Reduce Column Count
During the import column mapping step, exclude columns that are not needed for matching or analysis. Fewer columns mean less profiling work. You can always re-import with additional columns later if needed.
4. Check Server Resources
Profiling is CPU and memory intensive. If the MatchLogic server is under heavy load from other jobs (e.g., a simultaneous matching run), profiling will take longer. If possible, schedule profiling during off-peak hours.
When to Suspect a Failure
Profiling should not stall indefinitely. If the job shows no progress for more than 30 minutes on a medium-sized dataset:
- Open the Job Status Dialog (clock icon in the header) and check for an error message.
- If the status shows "In Progress" with no error, wait a bit longer before concluding it is stuck.
- If the status shows "Failed," check the error message for guidance, fix the underlying issue, and re-run profiling.
- If the status appears frozen with no update for 60+ minutes, try canceling the job and restarting it.
Do not start multiple profiling jobs simultaneously on the same datasource. If a job appears stuck, cancel it before starting a new one to avoid resource contention.