Detailed Analysis View
The Detailed Analysis tab provides a comprehensive, record-level view of your profiling results. While the Overview dashboard gives you a visual summary, the Detailed Analysis lets you drill into exact numbers, sort and filter metrics, inspect individual patterns, and preview the actual data behind the statistics.
Two Sub-Views
The Detailed Analysis tab offers two perspectives on your data:
Standard View
The Standard View displays a metrics table with one row per column in your datasource. Each row shows all quality metrics for that field:
- Field name -- The column name from your datasource
- Data type -- The detected type and confidence
- Completeness -- Fill rate percentage
- Uniqueness -- Distinct value percentage
- Validity -- Valid value percentage
- Anomalies -- Number of flagged anomalies
- Quality score -- Overall quality rating for the field
Click any column header to sort the table by that metric. This makes it easy to find, for example, the fields with the lowest completeness or the highest outlier counts.
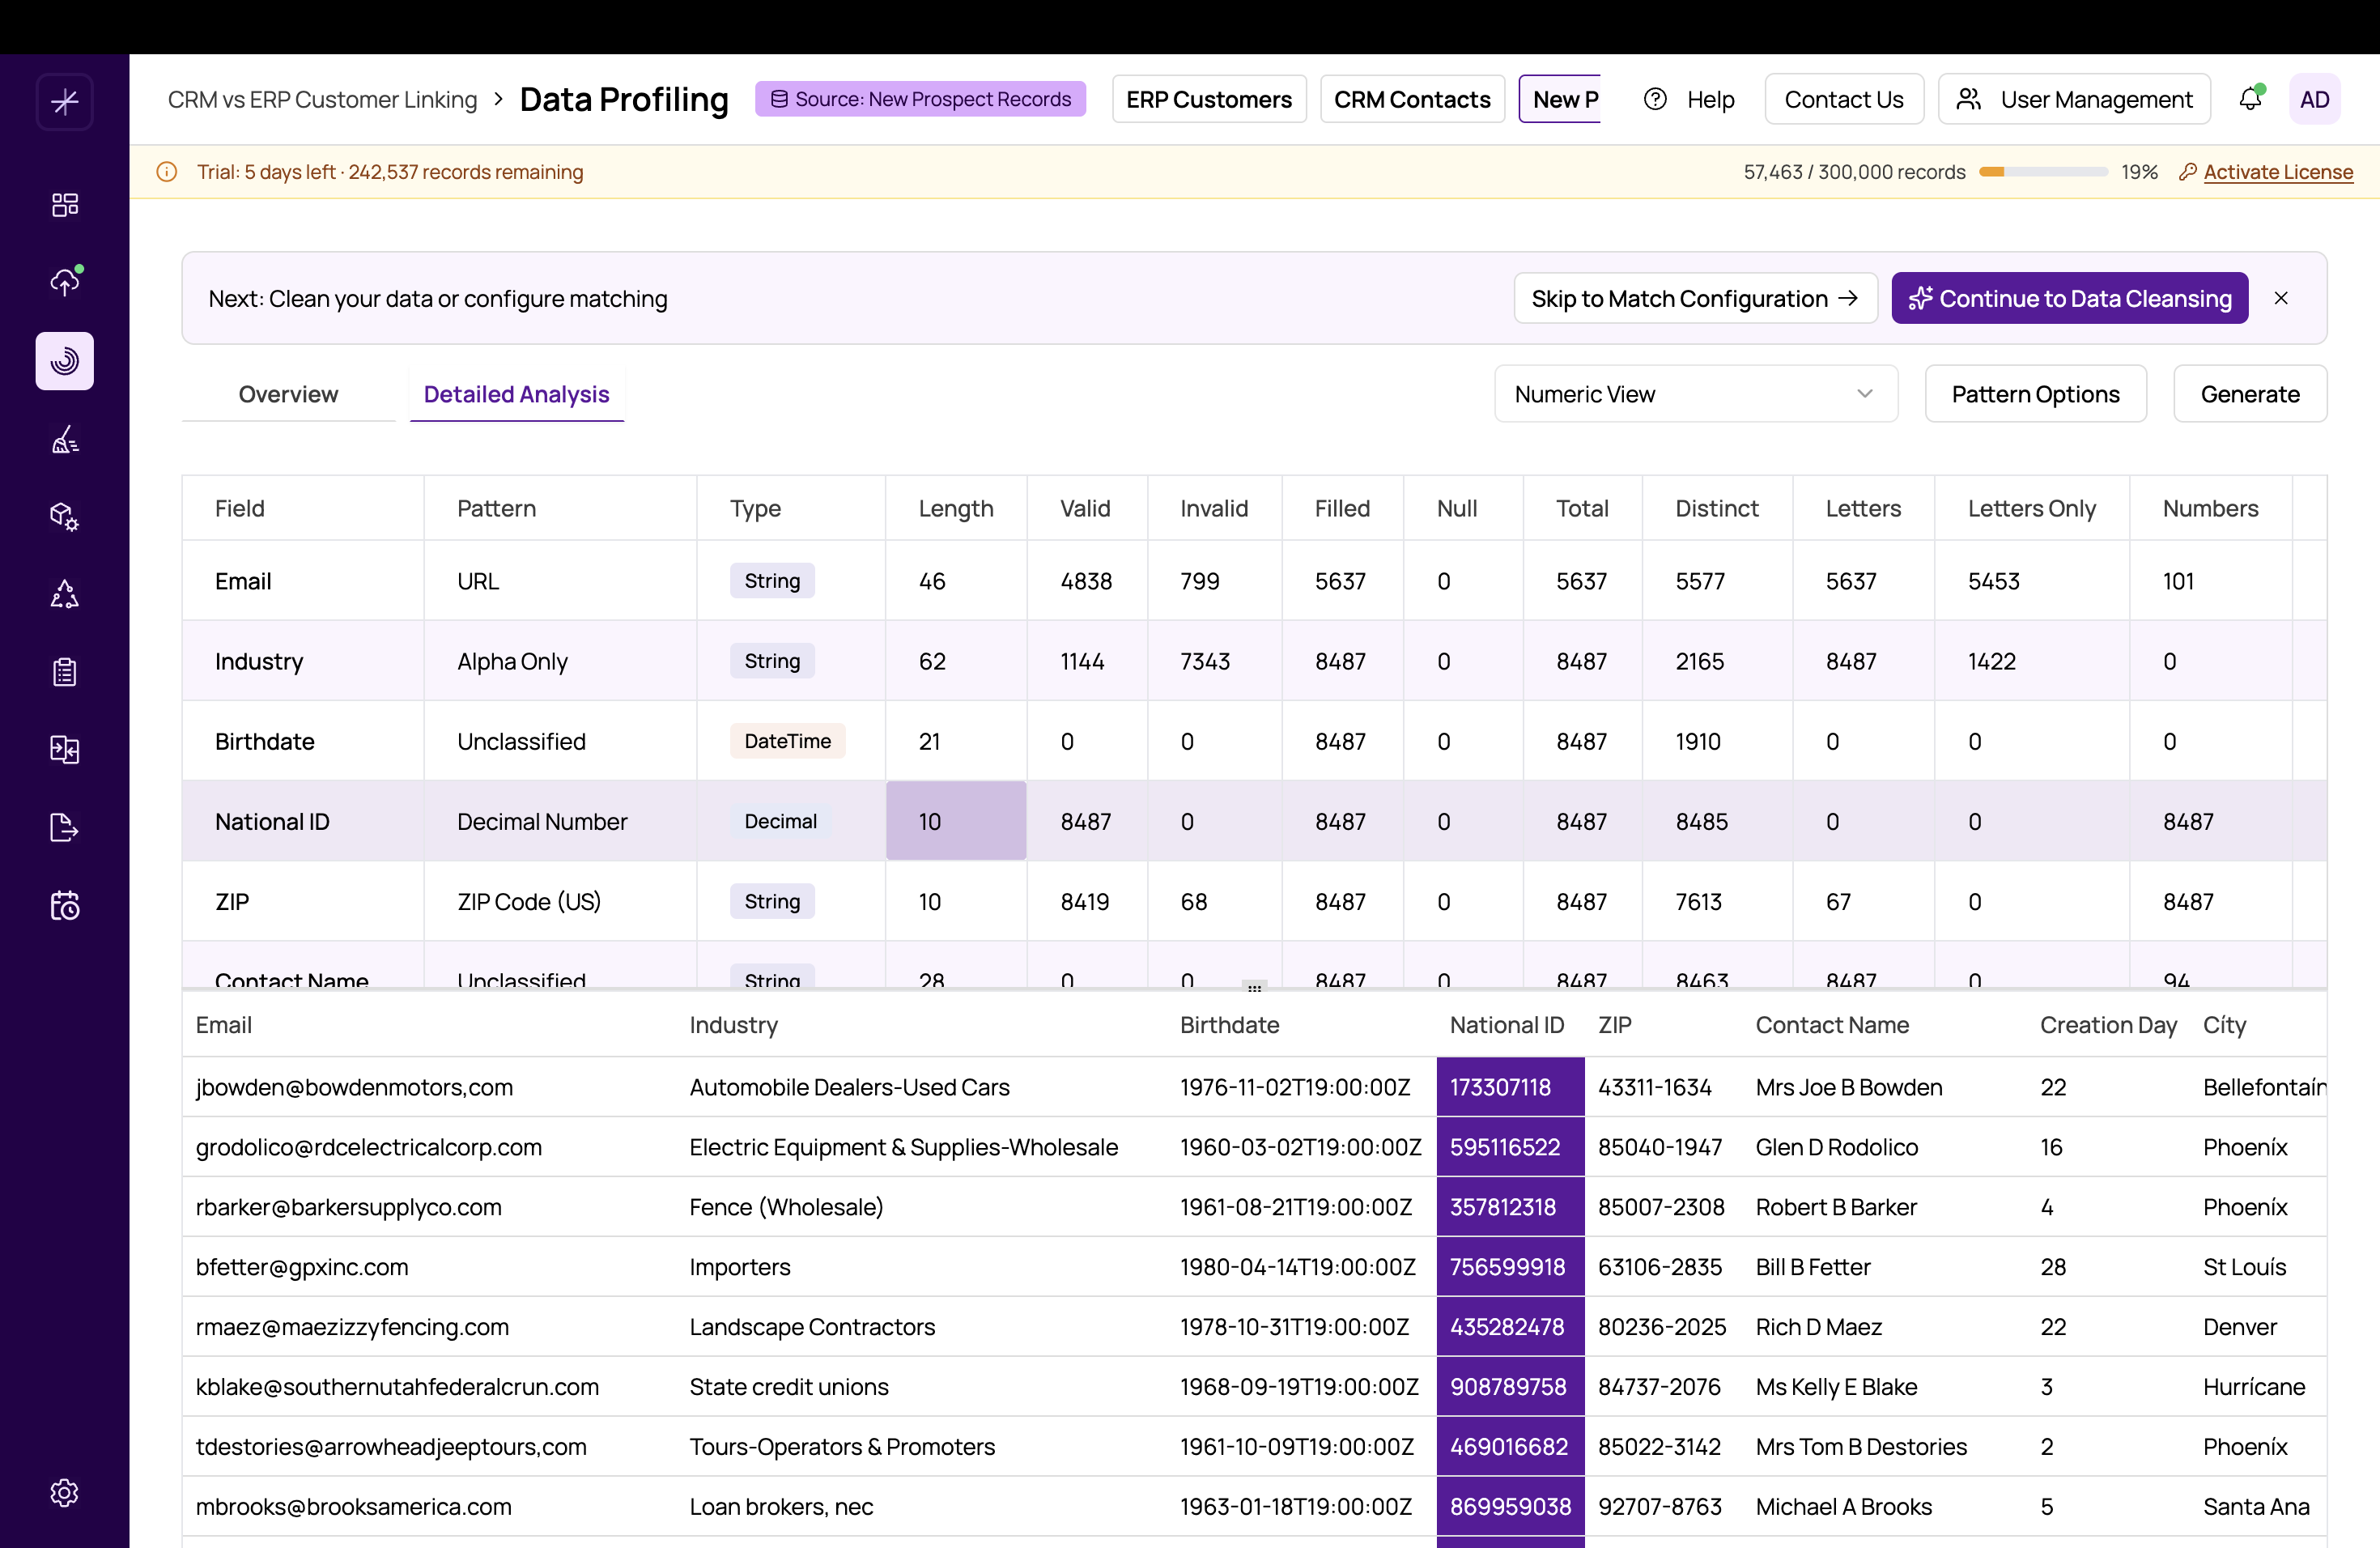
Numeric View
The Numeric View filters to only show fields detected as numeric types and displays statistical metrics. See https://help.matchlogic.io/article/234-numeric-statistical-summary for full details on min, max, mean, median, and mode analysis.
Interacting with the Table
The metrics table is fully interactive:
- Click any cell to filter the data preview panel below to show records related to that metric. For example, clicking the null count for a field shows records where that field is null.
- Sort columns by clicking headers to rank fields by any metric.
- Resize the split panel by dragging the divider between the metrics table and the data preview below. Make the preview larger when you need to inspect records, or shrink it to focus on the metrics.
Data Preview Panel
Below the metrics table, a data preview panel displays the actual records from your datasource. This panel updates based on your selections in the table above. You can:
- Browse records with pagination
- See the raw values that contribute to each metric
- Verify that flagged issues (nulls, outliers, invalid values) are genuine problems
Pattern Analysis Panel
When you select a field in the metrics table, the Pattern Analysis panel shows the discovered patterns for that field. Each pattern displays:
- The pattern structure (e.g.,
AAAA AAAAfor "first last" name format) - The count of records matching that pattern
- The percentage of total records
Click on any pattern to filter the data preview to show only records matching that specific pattern. This is invaluable for understanding exactly what your data looks like and planning targeted cleansing rules.
Tip
Use the Detailed Analysis view to build your data cleansing strategy. Click through each field, review its patterns and outliers, and note which transformations you need to apply in the https://help.matchlogic.io/article/235-introduction-to-flow-builder.
Important
The data preview panel shows a paginated sample of your records. For very large datasources, use the filter and sort capabilities to find the specific records you need rather than scrolling through pages.