The Summary Tab
After a match completes, the Summary tab provides a quality report dashboard that gives you an at-a-glance assessment of your match results. This is the first view you see when match results load, and it helps you decide whether to proceed with merge and survivorship or refine your definitions first.
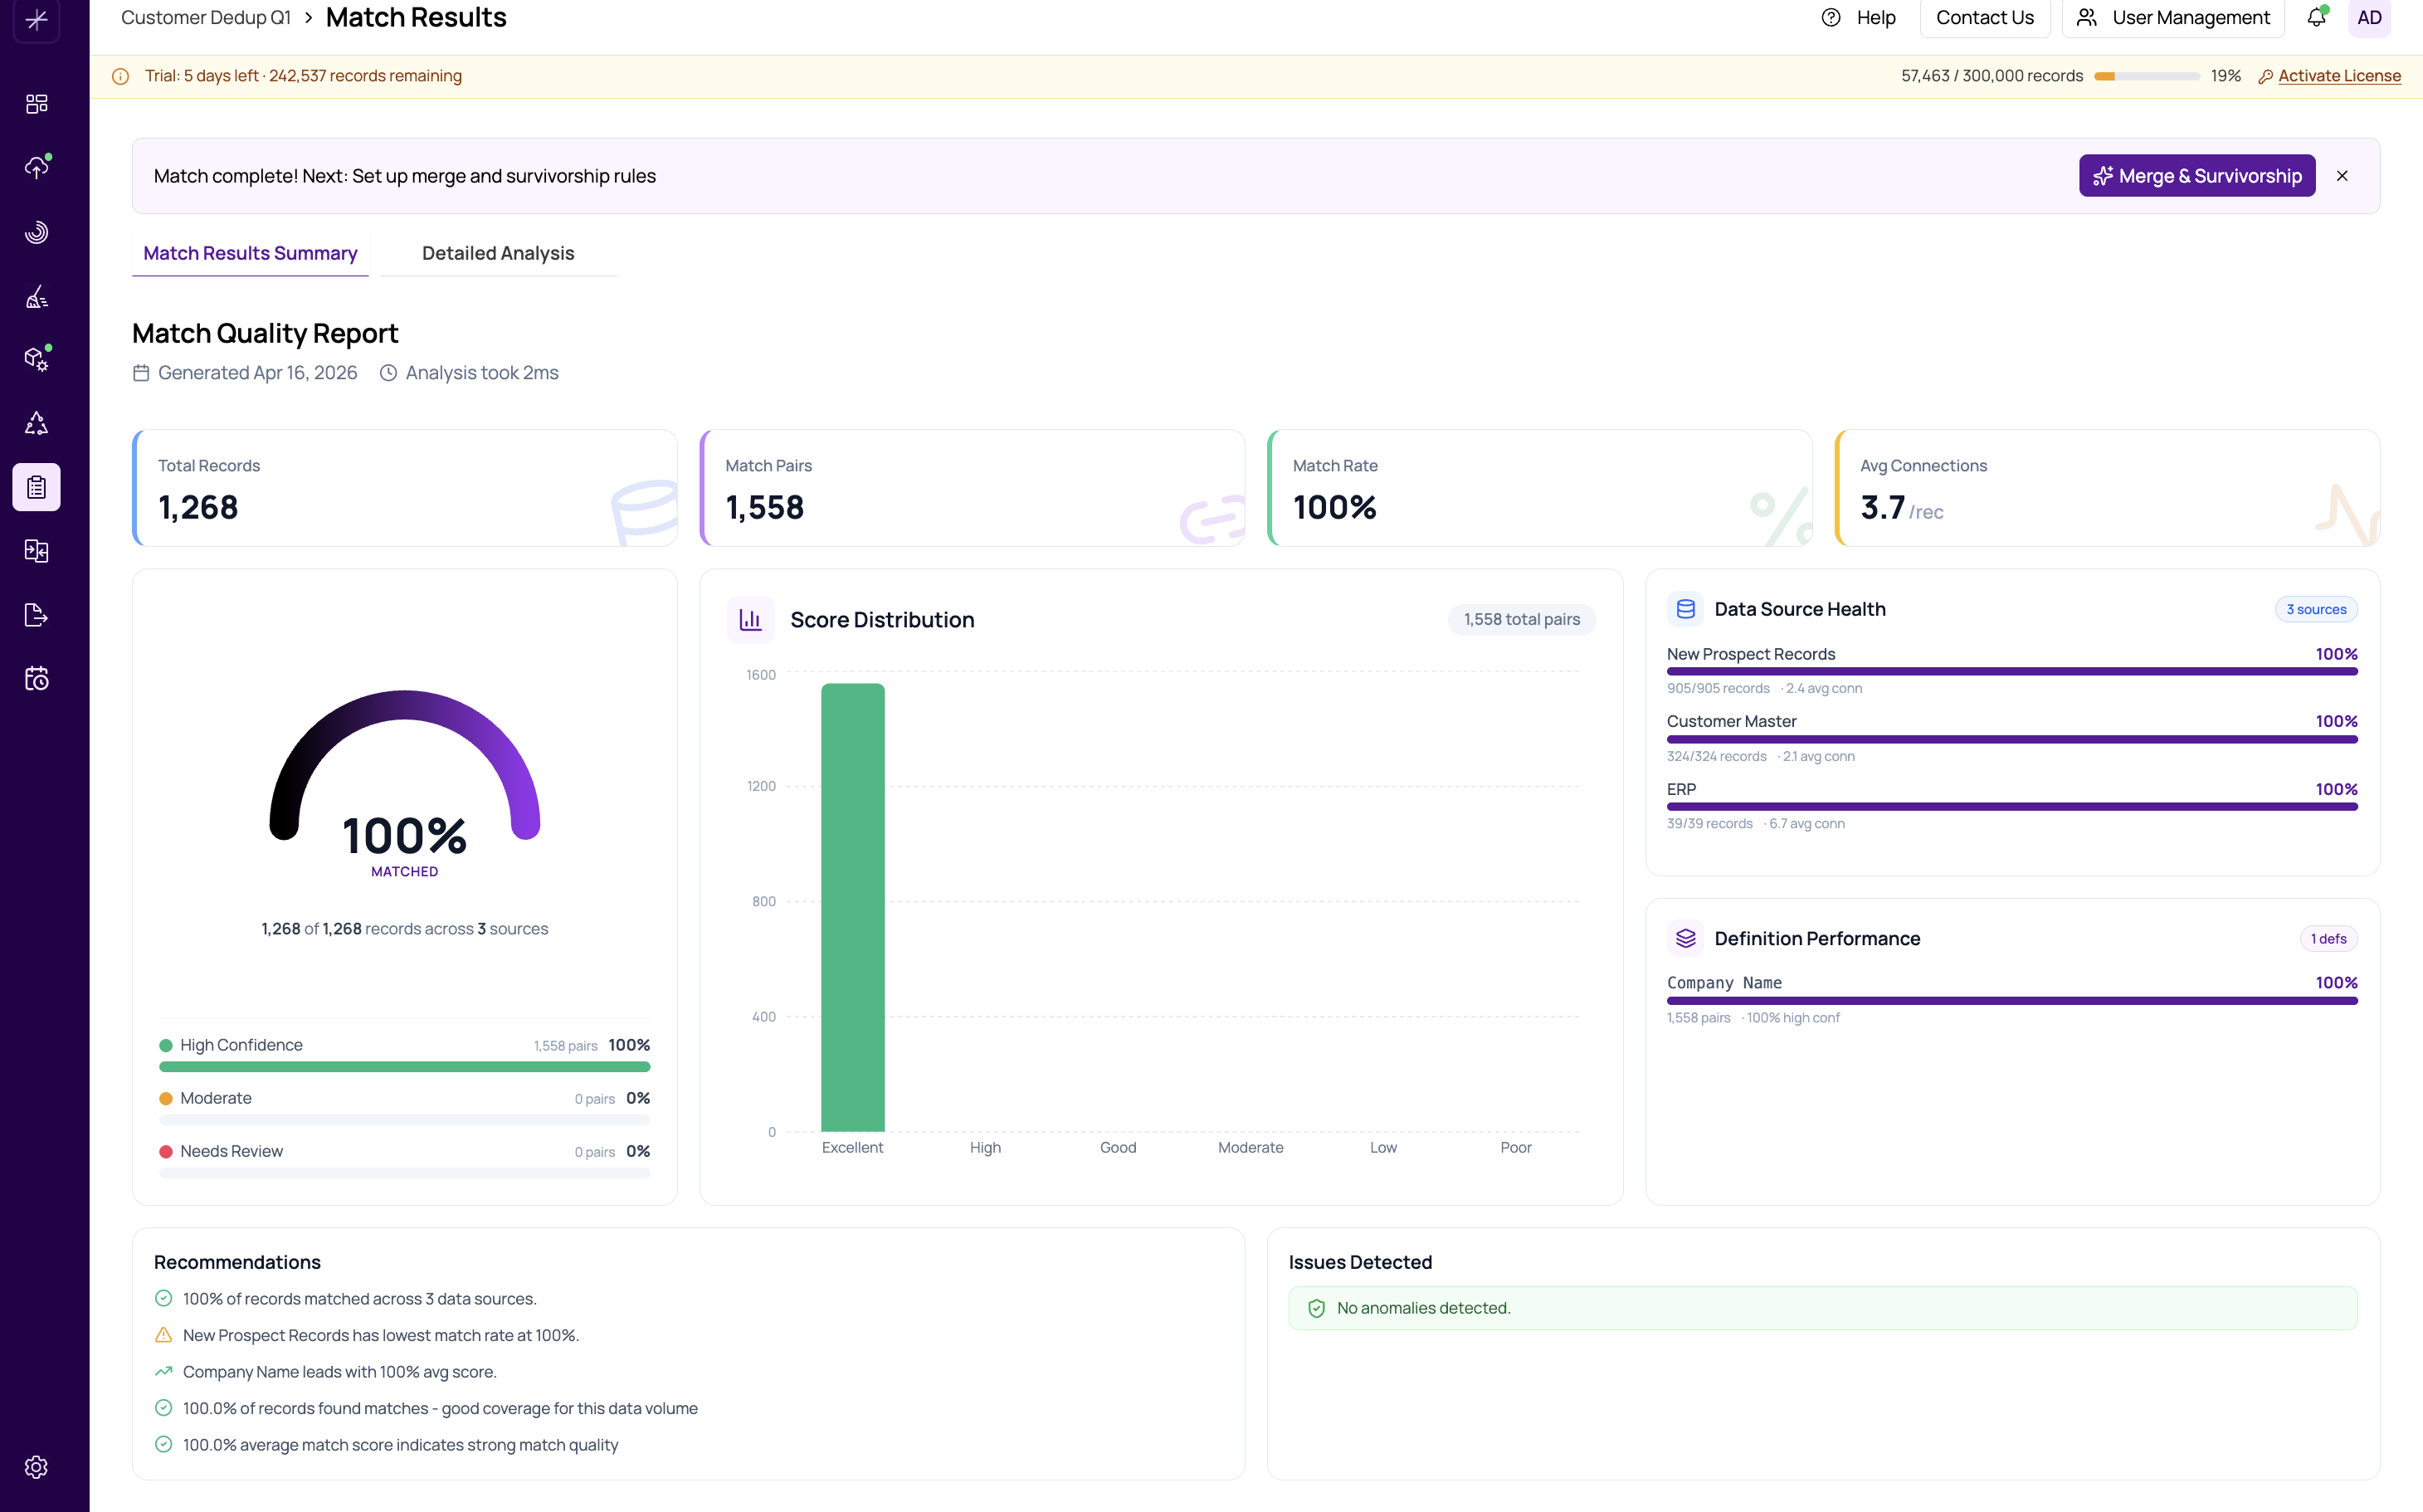
Hero Gauge
At the top of the dashboard, a large semicircle gauge displays the overall matched percentage of your data. The gauge is color-coded into three zones:
- Green zone — high-confidence matches
- Amber zone — moderate-confidence matches that may need review
- Red zone — needs review, indicating potential quality issues
The percentage shown represents how many of your total records are involved in at least one match pair.
KPI Strip
Below the gauge, a row of key performance indicators provides essential metrics at a glance. See understanding-kpis-quality-score for detailed explanations of each metric:
- Total Records — the combined count of records across all datasources
- Match Pairs — the number of matched record pairs found
- Match Rate — the percentage of records involved in matches
- Avg Connections — the mean number of links per matched record
Score Distribution Chart
A bar chart groups all match pairs by their score range, letting you see the confidence profile of your results. Each bar represents a score band (for example, 95-100 or 80-94), and the height indicates how many pairs fall in that range. See score-distribution-confidence-bands for details on the confidence bands.
Data Source Health Card
This card shows per-datasource match metrics, highlighting which sources contributed the most matches and which may have quality issues. It helps identify whether a particular source is underperforming. See data-source-health-report for an in-depth guide.
Definition Performance Card
This card compares how each match definition performed, showing which definitions generated the most matches and their score distributions. Use this to evaluate whether all your definitions are contributing value. See definition-performance-comparison for details.
Anomalies and Insights
At the bottom of the dashboard, the Anomalies section flags unusual patterns, and the Insights row provides actionable recommendations. These sections help you spot issues quickly without digging into the detailed data. See anomalies-and-insights for more information.
Tip
Use the Summary tab as your first stop after every match run. If the hero gauge shows a lower percentage than expected, review the insights section for recommendations before diving into the detailed pairs and groups views.